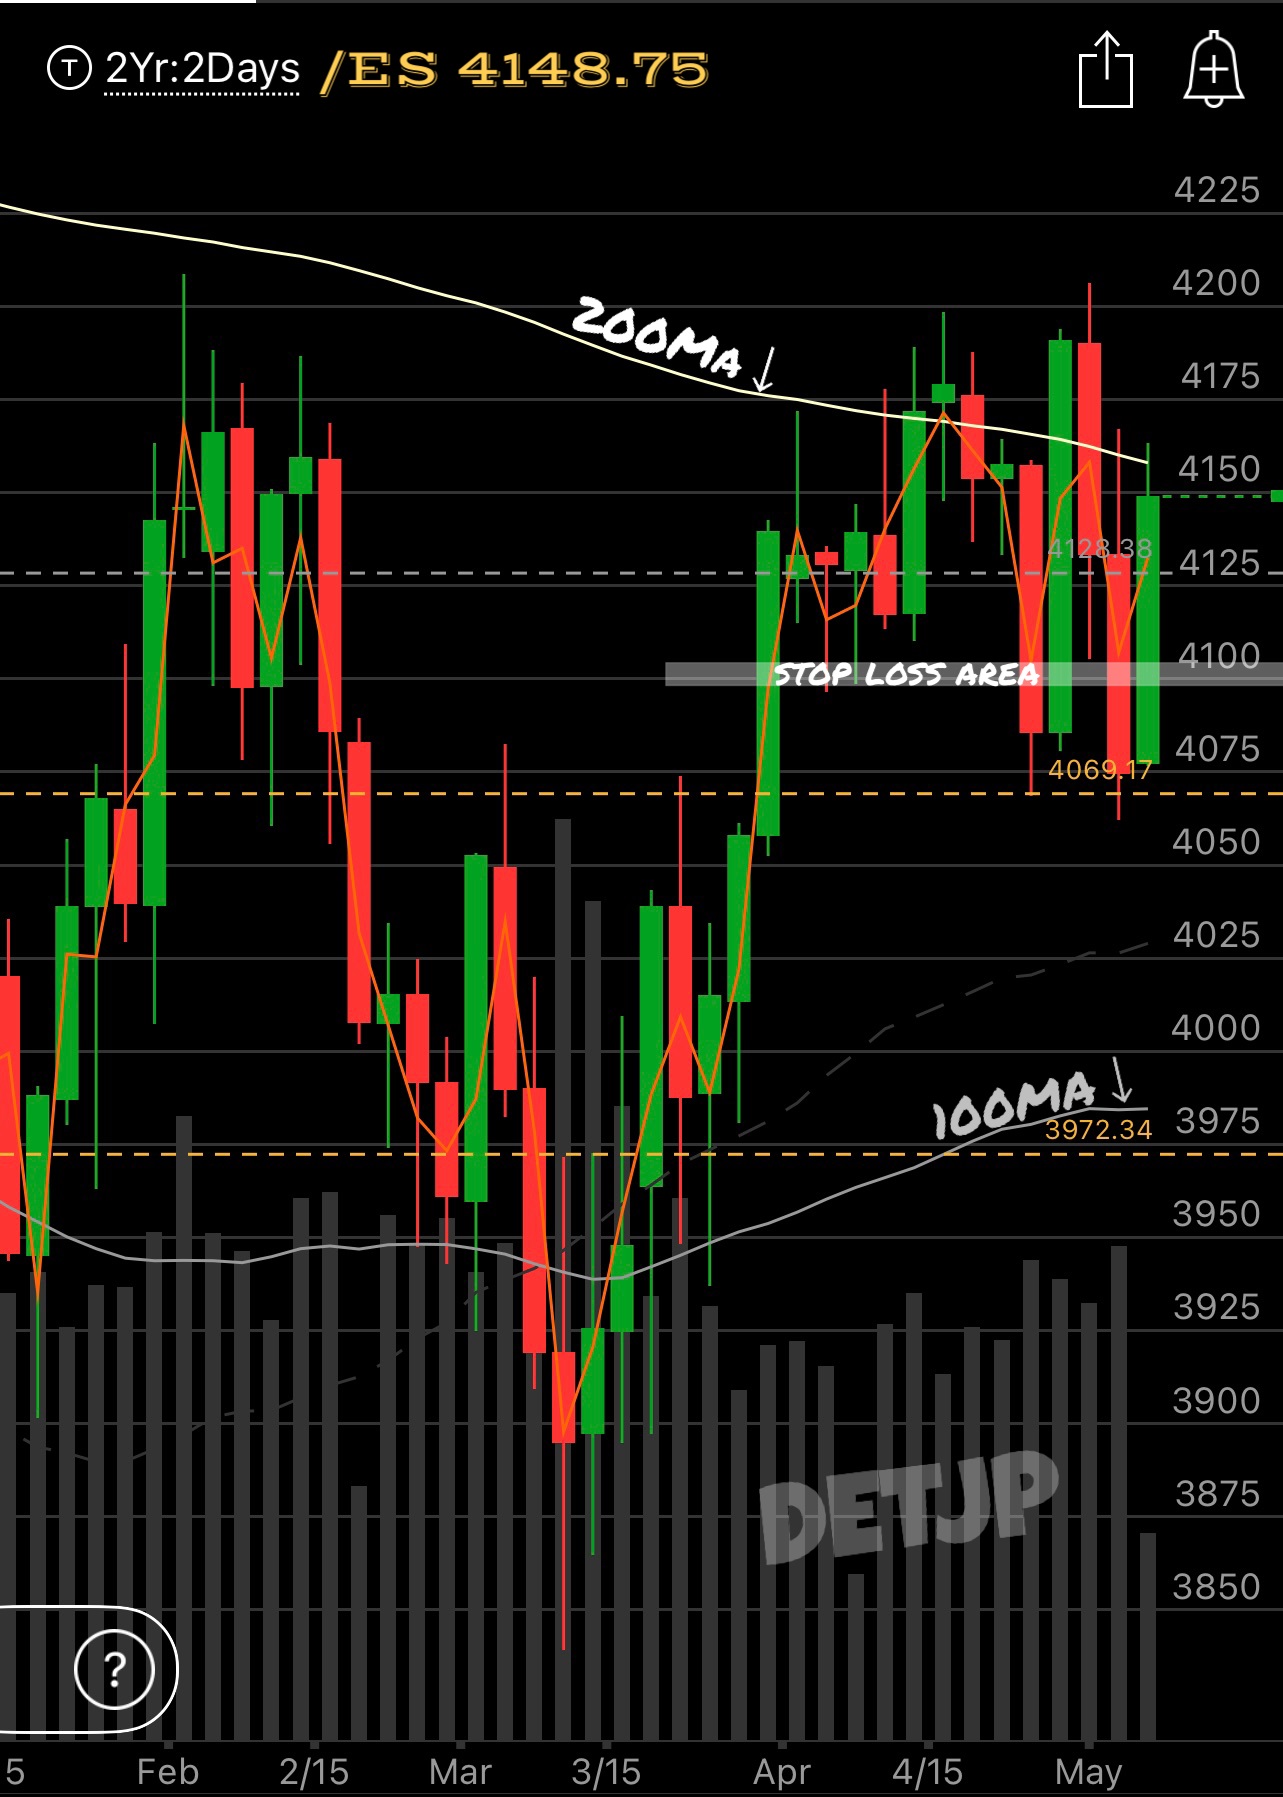
Chart of the Week (5/7/2023)

/ES Trade Idea - Buyers currently have the momentum so I expect more upside then a decent pullback after inflation numbers come in hot on Wednesday to restart rate hike rumors. Posting the SP500 chart this week because it has better trading areas... Resistance at 200MA(4160) for sells and 4128 acting as support for buys.
Short Term Option Trade -
We all have different time horizons, short term trades for me are at least 2 weeks long but once my price target has been reached I remove risk.
RISK DISCLAIMER: Trade at YOUR OWN RISK, I am NOT a Financial Professional and I do not post nor offer financial advice. My trade ideas are simply visual representations of my thought process.


