
Chart of the Week (6/4/2023)
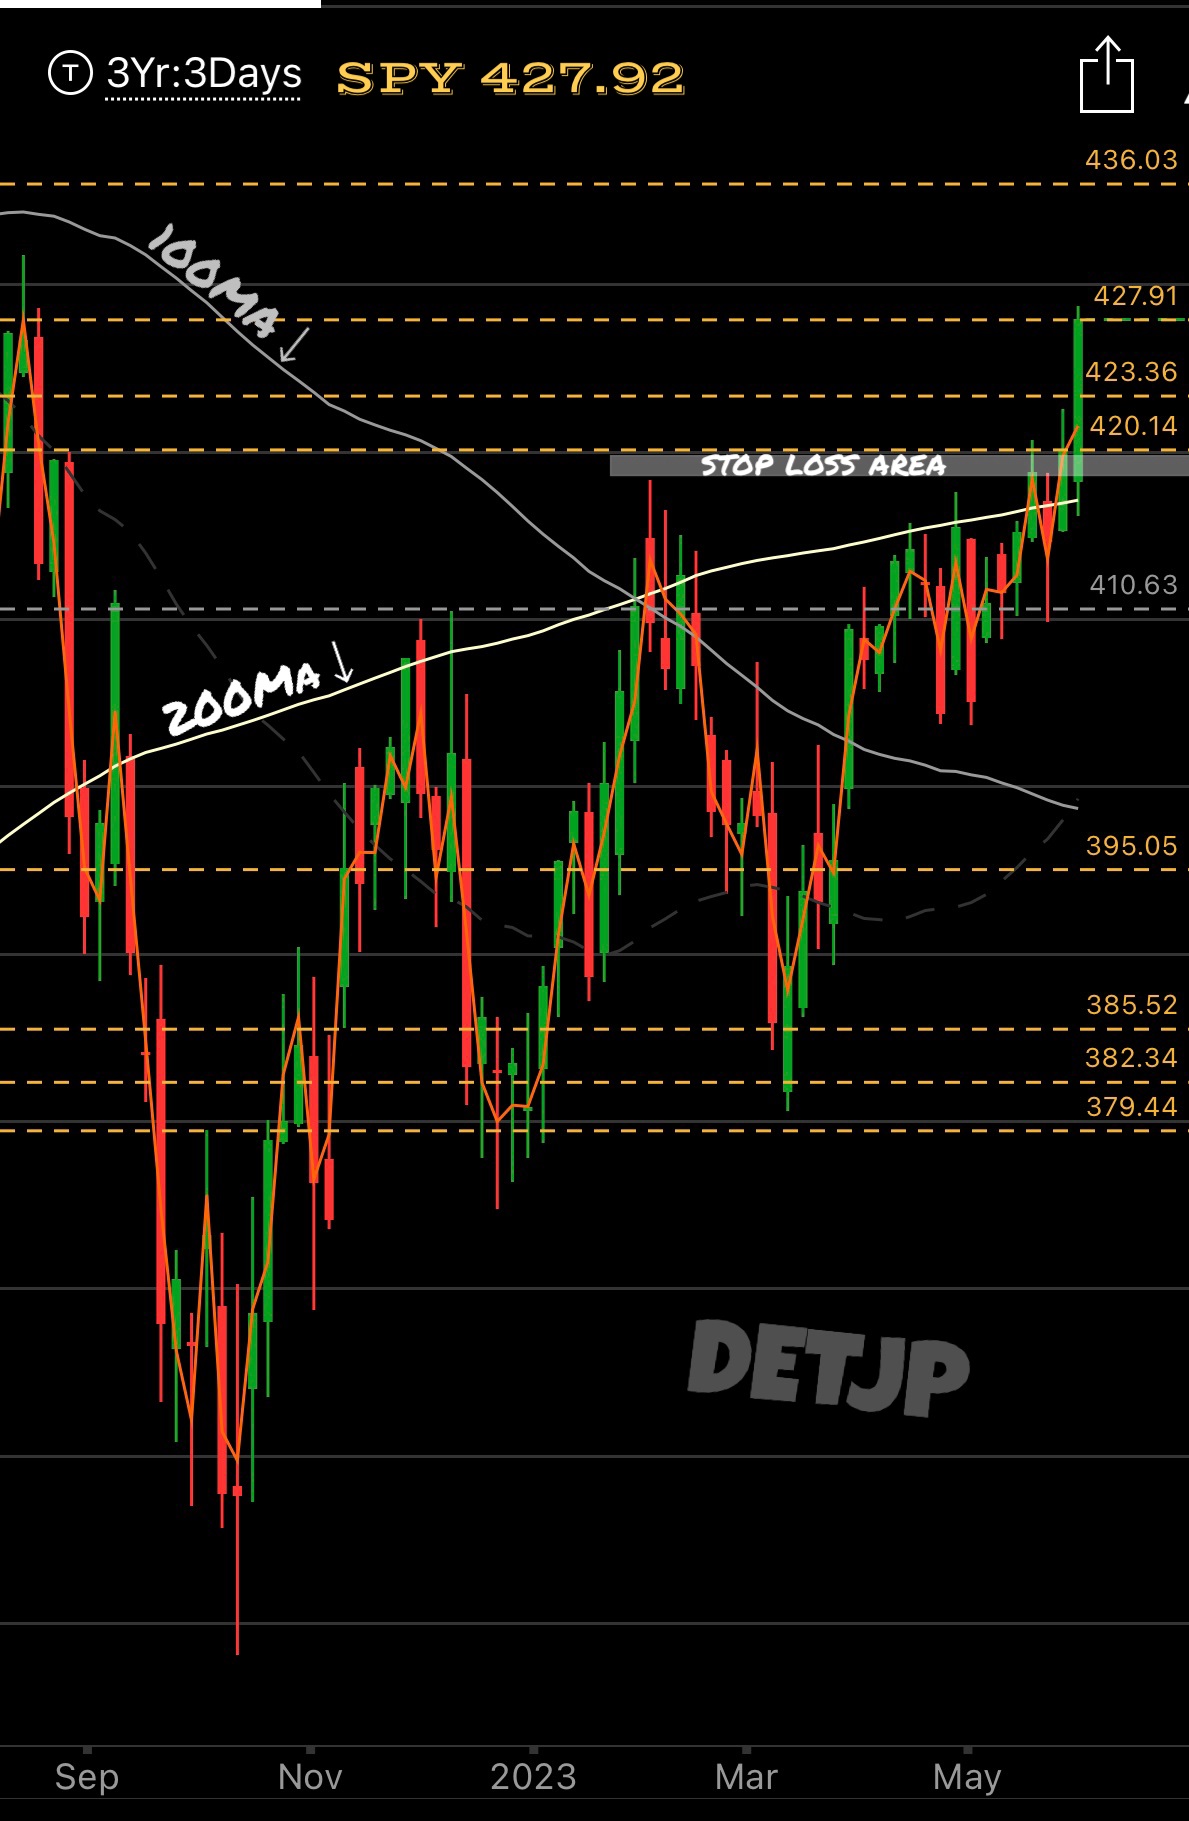
SPY Trade Idea - Big tech carries us back to the August highs of last year as the regional banking sector recovers from multiple collapses,
inflation starts to cool faster than expected and after only three weeks of debt deal negotiations House Speaker flips and
decides to help pass a deal that adds 4 Trillion in spending and NO tax increases while taking a default off the table until 2025.
| NEXT WEEK
Now the focus shifts back to where the August selloff began with the Fed Funds Rate target only .25 basis points away from the initial 5.50 Funds Rate target. The Fed will return from a two week break on the 15th with a better than expected job market, trillions in new spending incoming and rate hike pause expectations in July.
Bank deposits are rising again after record outflows found nowhere to park their cash and overbought "risk off dollar" assets like gold and crypto rejecting resistance.
A catalyst to watch for a selloff is the Fed reversing course by raising rates any higher than expected and/or increasing the amount they are reducing the balance sheet by each week.
Long Term Option Trade - We all have different time horizons, long term trades for me are at least 3 months long but once my price target has been reached I remove risk.
RISK DISCLAIMER: Trade at YOUR OWN RISK, I am NOT a Financial Professional and I do not post nor offer financial advice. My trade ideas are simply visual representations of my thought process.